Content: General | Processing Strategy | Data Holding | Data Versions | Citation
This product contains river discharge time series which are estimated by using remote sensing data only. It can provide important information for hydrological applications such as models. The figure on the right shows as an example the discharge for the Lena, River.


This product is estimated within the processing strategry of volume variations for lakes and reservoirs. Therefore, more information can be found here.
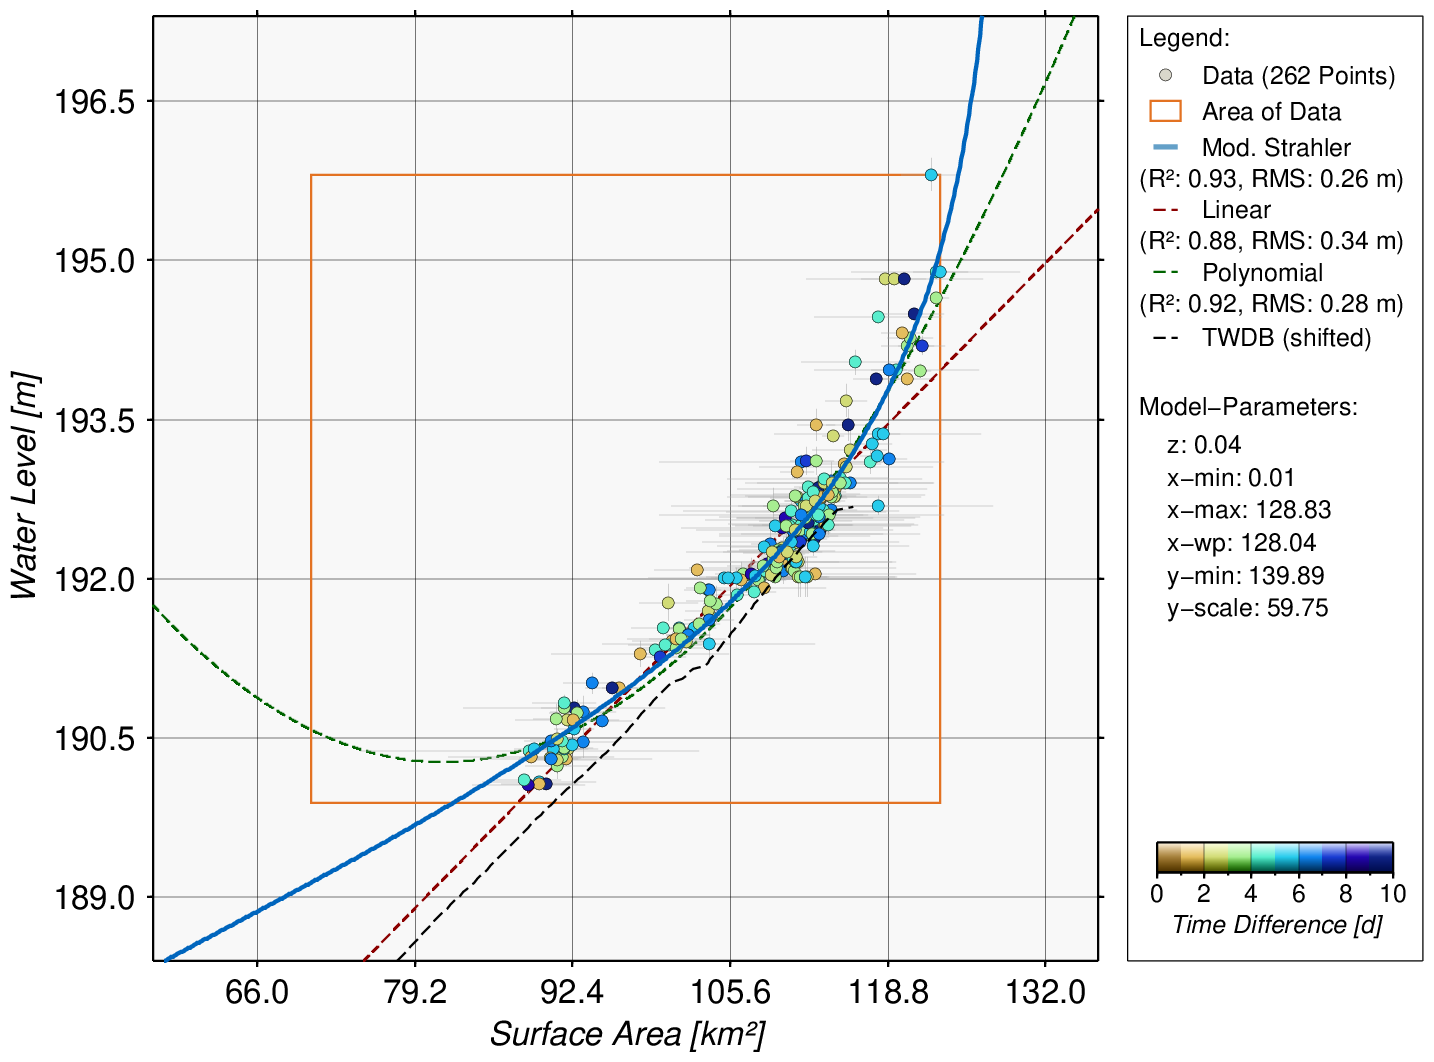
DAHITI currently provides 69 hypsometry models distributed over all continents, except Antarctica. In Africa (8 time series), Asia (7), Australia (1), Europe (4), North America (42), and South America (7) water occurrence masks are available. The hypsometry models in DAHITI are freely available and can be downloaded after a short registration process. The amount of hypsometry models is permanently increasing.
This product is processed in the processing chain of volume variations.
More information can be found here.